Introduction
In this summertime post in the case4base series, we will look at useful tools in base R, which let us profile our code without any extra packages needed to be installed. We will cover simple and easy to use speed profiling, more complex profiling of performance and memory and, as always, look at alternatives to base R as well, with a special shout out to profiling integration in RStudio.
Contents
Simple time profiling with system.time
Base function system.time returns the difference between two proc.time calls within which it evaluates an expression provided as argument. The simplest usage can be seen below:
system.time(runif(10^8))## user system elapsed
## 4.376 0.448 4.836For the purpose of processing the results, we can of course store and examine them within a variable where we can see that it is in fact a numeric vector with 5 elements with a proc_time class. It uses summary as its print method via the print.proc_time. For most our purposes, we would be interested in the “elapsed” element of the result, giving us the ‘real’ elapsed time since the process was started:
tm <- system.time(runif(10^8))str(tm)## Class 'proc_time' Named num [1:5] 4.376 0.448 4.836 0 0
## ..- attr(*, "names")= chr [1:5] "user.self" "sys.self" "elapsed" "user.child" ...tm["elapsed"]## elapsed
## 4.836We can also very simply run multiple observations for an expression and investigate the results:
expr <- rep(expression(runif(10^8)), 10L)
tm <- unlist(lapply(expr, function(x) system.time(eval(x))["elapsed"]))
summary(tm)
## Min. 1st Qu. Median Mean 3rd Qu. Max.
## 4.779 4.804 4.816 4.828 4.854 4.893With a little tweaking we can also run it in a separate process to not block our R session:
script <- shQuote(paste(
  'expr <- rep(expression(runif(10^7)), 10L)',
  'tm <- unlist(lapply(expr, function(x) system.time(eval(x))["elapsed"]))',
  'print(summary(tm))',
  sep = ';'
))

system2('Rscript', args = c('-e', script), wait = FALSE)
Profile R execution with Rprof
The utils package included in the base R releases contains a very useful pair of functions for profiling by sampling every interval of seconds:
- Use
utils::Rprof()to enable the R profiling, run the code to be profiled and useutils::Rprof(NULL)to disable profiling - Afterwards, use
utils::summaryRprof()to investigate the results
The most simplistic usage is really this straight-forward:
# Enable profiling
utils::Rprof()

# Run the code to be profiled
x <- lapply(10^(6:7),  runif)
y <- lapply(x, summary)
z <- sort(x[[2]])

# Disable profiling
utils::Rprof(NULL)

# Read the profiling results and view
res <- utils::summaryRprof()
res[["by.self"]]
The profiling can be customized with arguments such as filename, which specifies to which file will the results be written (and also serves as the off switch if set to NULL or ""), interval, which governs the time between profiling samples. More can be found in the function’s help.
Perhaps the most interesting argument is memory.profiling which if set to TRUE will add memory information into the results file:
# Enable profiling with memory profiling
utils::Rprof(filename = "ProfwMemory.out", memory.profiling = TRUE)

# Run the code to be profiled
x <- lapply(10^(6:7),  runif)
y <- lapply(x, summary)
z <- sort(x[[2]])

# Disable profiling
utils::Rprof(NULL)

# Read the profiling results and view results in different ways
utils::summaryRprof(
  filename = "ProfwMemory.out",
  memory = c("stats"),
  lines = "show"
)

utils::summaryRprof(
  filename = "ProfwMemory.out",
  memory = c("both")
)[["by.self"]]
Non-sampling memory use profiling with Rprofmem
Base R also offers an option to profile memory use (if R is compiled with R_MEMORY_PROFILING defined) using Rprofmem - a pure memory use profiler. Results are written as simple text into a file, from which they can be read, however the processing of the result may use a bit more polishing here:
# Enable memory profiling profiling
utils::Rprofmem("Rprofmem.out", threshold = 10240)

# Run the code to be profiled
x <- runif(10^5)
y <- runif(10^6)
z <- runif(10^7)

# Disable profiling
utils::Rprofmem(NULL)

# Read the results
readLines("Rprofmem.out")
If our concern is specifically copying of (large) objects which negatively impact the memory requirements of our work, we can (provided that R is compiled with --enable-memory-profiling). Use tracemem(object) to mark object for tracking and print a stack trace it is duplicated. untracemem(object) untraces the object.
For more details see the references section.
Profiling integration within RStudio
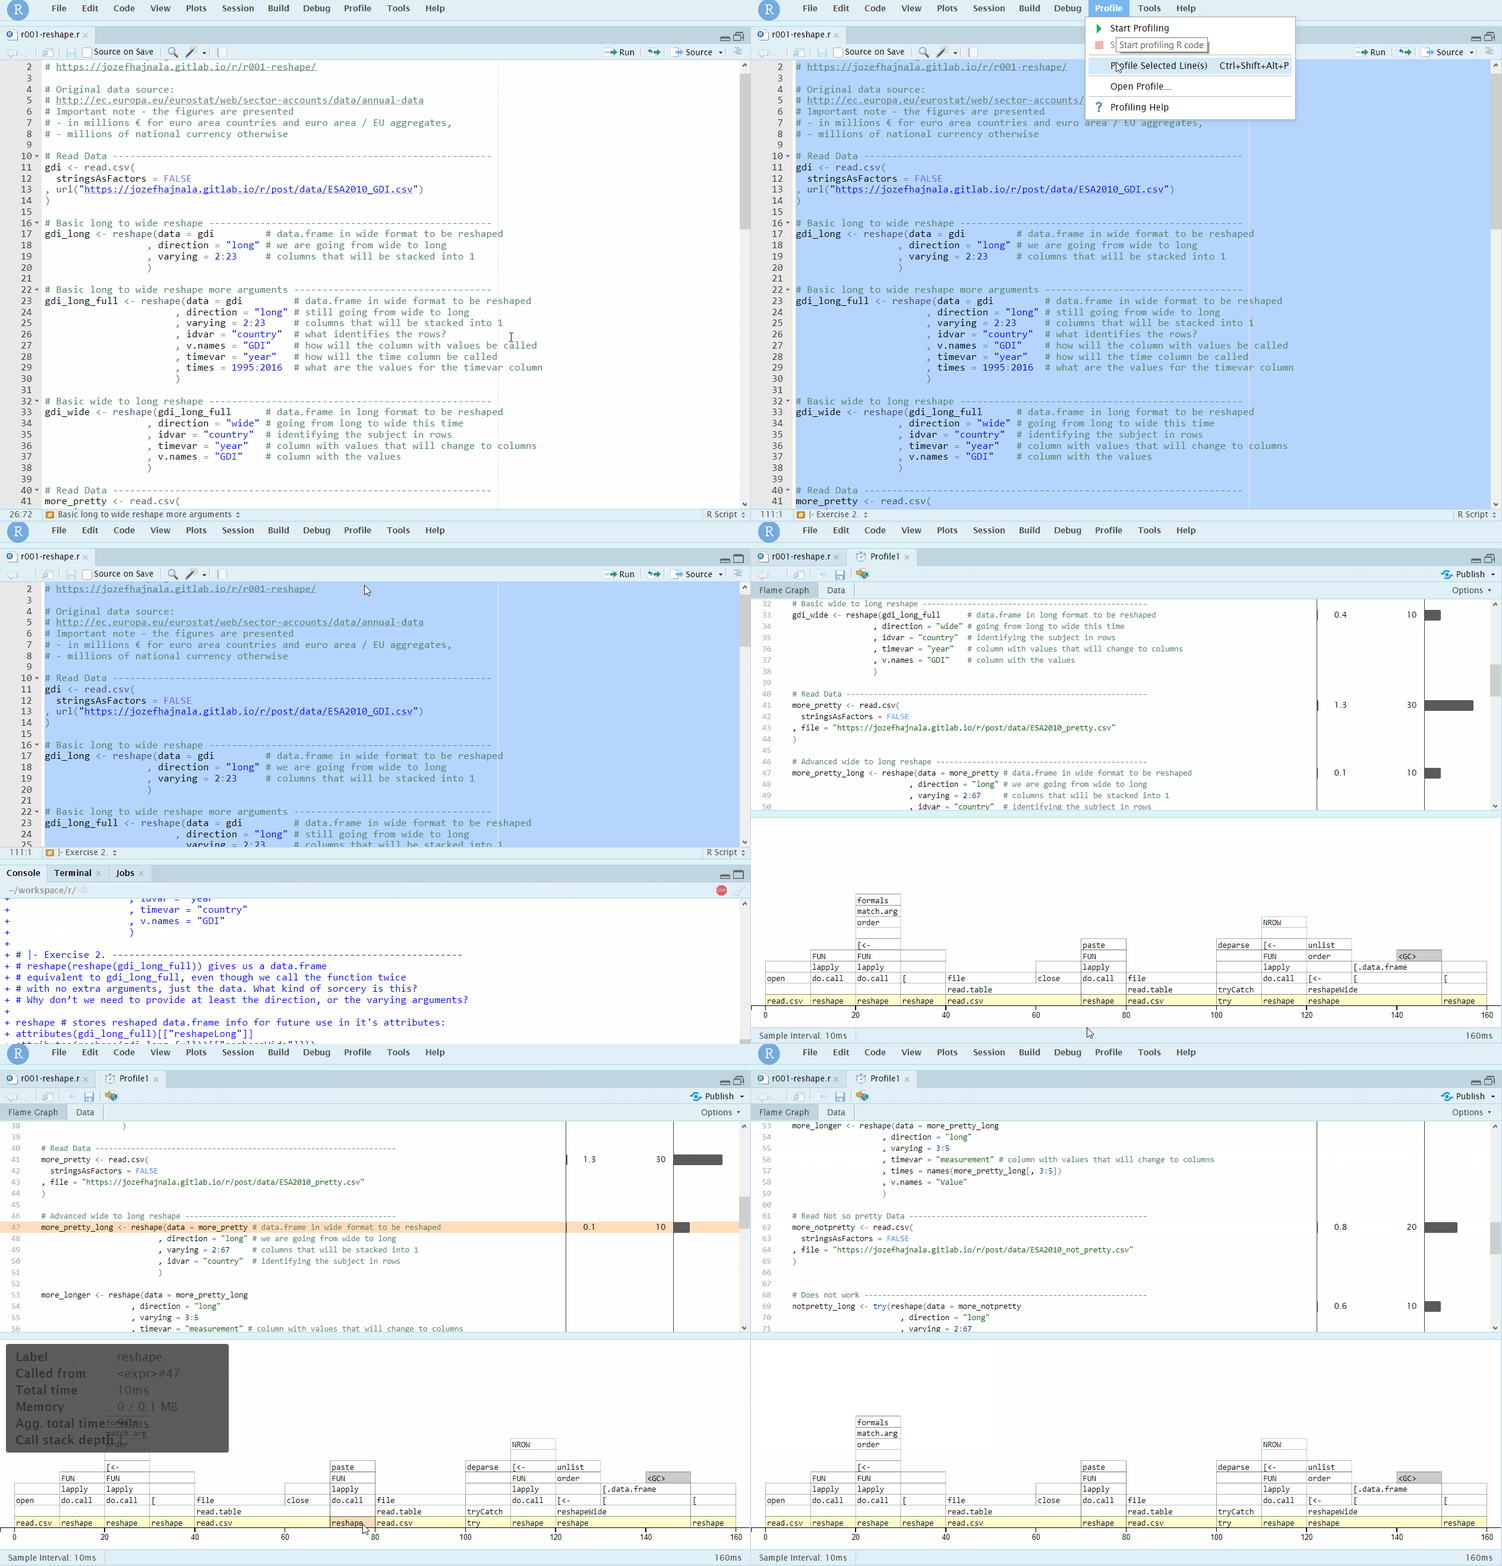
Even though this does not really adhere to the case4base rules, we still mention the RStudio profiling integration, which is done using the profvis package and if successful, works really well and provides informative graphical outputs. All we have to to it either select a chunk of code and click on Profile -> Profile Selected Line(s), or click on Profile -> Start Profiling, run our code and then Profile -> Stop profiling. RStudio should then automatically use profvis to produce an interactive output that allows nice exploration of the results:

RStudio+profvis
Background profiling with base R via an RStudio addin
We have also created and written about an RStudio addin that let users profile R code selected in RStudio, with the advantage that the profiling runs asynchronously in a separate process not blocking the current R session and also not requiring external packages such as profvis. You can read more about it and get it here.
Alternatives to base R
References
- Profiling R code for speed at Writing R Extensions
- Profiling R code for memory use at Writing R Extensions
- system.time help
- Memory profiling in R