Introduction
Profiling our code is a very useful tool to determine how well the code performs on different metrics.
The addin we will create in this article will let us use a keyboard shortcut to run profiling on R code selected in RStudio without blocking the session or requiring any external packages.
Specifically for very simple overview use, it may be beneficial to look at the time needed for a set of expressions to compute, e.g. how fast the code is. Secondly, especially important in case of computing on big datasets in-memory, the amount of memory utilized, e.g. how much RAM was used.
The addin in action
Contents
Profiling options provided by base R
Without going into any detail at all, we have 2 very nice options to profile our code with base R:
base::system.time(expr)- returns CPU and other times thatexprusedutils::Rprof- can serve as a switch to enable and disable profiling, with a variety of options, saving the results into a file on disk, by default"Rprof.out"
For the use of our addin, we will utilize the second approach, as we are interested not only in time spent, but also in memory utilization of the profiled expressions.
After finishing the profiling, we will use utils::summaryRprof to summarize the results provided to us by the Rprof functionality mentioned above. To get an overview, we will examine only the total time the selected expressions took to execute and the maximum memory.
The very simplistic implementation can look as follows:
profileExpression <- function(expr) {
  on.exit({
    unlink("Rprof.out")
    utils::Rprof(NULL)
  })

  if (!is.expression(expr)) {
    message("epxr must be an expression in profileExpression()")
    return(data.frame(
      totalTime = numeric(0),
      maxMemory = numeric(0)
    ))
  }
  gc()
  utils::Rprof(
    memory.profiling = TRUE,
    interval = 0.01,
    append = FALSE
  )
  evalRes <- try(eval(expr), silent = TRUE)
  utils::Rprof(NULL)
  if (inherits(evalRes, "try-error")) {
    return(data.frame(stringsAsFactors = FALSE,
                      totalTime = "EvalError",
                      maxMemory = "EvalError"
    ))
  }
  res <- utils::summaryRprof(memory = "both")
  data.frame(
    totalTime = max(res[["by.total"]][, 1L]),
    maxMemory = max(res[["by.total"]][, 5L])
  )
}
Since we maybe be interested in more than one execution of the expressions to be profiled and the profiling will be running in background, a wrapper executing the profiling itself multiple times may come in handy. Except the number of times to execute, which is a very standard argument, we can also attempt to provide a time frame we want to invest into the profiling:
multiProfile <- function(
  expr,
  times = 10L,
  maxtime = getOption("jhaddins_profiler_maxtime", default = NULL)
){
  if (!(is.integer(times) || is.integer(maxtime))) {
    message("Times or maxtime must be integer in multiProfile()")
    return(data.frame(
      totalTime = numeric(0),
      maxMemory = numeric(0)
    ))
  }

  first <- profileExpression(expr)
  if (!is.null(maxtime)) {
    if (is.numeric(first[["totalTime"]])) {
      times <- floor(maxtime / first[["totalTime"]])
    } else {
      message("Eval failed, cannot compute times from maxtime.")
      return(first)
    }
  }
  if (times <= 1L) {
    return(first)
  }
  rest <- do.call(
    rbind,
    lapply(rep(list(expr), times - 1L), profileExpression)
  )
  rbind(first, rest)
}
Asynchronous execution and communication of the results with the session
Since we are only using base R functionality without taking advantage of external packages that would help us execute the profiling asynchronously, we have 3 challenges:
- Asynchronous execution of the profiling
We can take advantage of base R’s convenient interface system2, which allows us to invoke OS commands, with the option to run asynchronously providing wait = FALSE as argument.
- Communicating the results between our R session and the one running via
system2
To kill two birds with one stone, we can simply use the rstudioapi to navigate to a created file, into which we will later write the profiling results using the asynchronously running process. This way we have the results immediately available within in RStudio and we can keep working conveniently on the tasks at hand. Since our application is very simple, we also avoid complications with communication between the processes for example via sockets.
- Contents of the workspace
When selecting a code chunk to profile in RStudio, it will likely happen very soon that the execution of expressions included in the selected code will rely on the current state of the global environment (aka. workspace). We can therefore make our functionality more convenient by storing the contents of the global environment on disk and loading it before running the profiler in our asynchronous process.
A simple example implementation of the thoughts above it once again presented below. Note that this implementation is very bare-bones and could use much polishing, which may happen sometime after publishing this article:
runProfiler <- function(
  inpContext = rstudioapi::getActiveDocumentContext()
){
  force(inpContext)
  inpString <- inpContext[["selection"]][[1L]][["text"]]
  cat(inpString, file = file.path("~/temp.R"))
  expr <- try(parse("~/temp.R"), silent = TRUE)
  if (inherits(expr, "try-error")) {
    message("Selected text cannot be parsed, cannot profile.")
    unlink(file.path("~/temp.R"))
    return(1L)
  }
  save(
    list = ls(all.names = TRUE, envir = .GlobalEnv),
    file = "~/tmp.RData",
    envir = .GlobalEnv
  )
  script <- paste(sep = "; ",
    "load('~/tmp.RData')",
    "res <- jhaddins:::multiProfile(parse('~/temp.R'))",
    "jhaddins:::writeProfileDf(res)",
    "unlink('~/temp.R')",
    "unlink('~/tmp.RData')"
  )
  file.create("~/tmp_prof.txt")
  rstudioapi::navigateToFile("~/tmp_prof.txt")
  system2(
    command = 'Rscript',
    args = c('-e', shQuote(script)),
    wait = FALSE
  )
  message("Profiler running in the background")
}
Results of the profiling
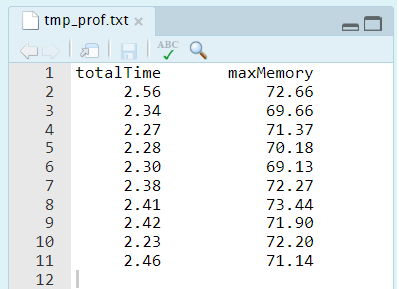
For the use that this simple functionality was developed, the main interest is knowing 2 very simple sets of information - how fast did the expressions execute and how much maximum memory was utilized. This is why the results are extracted and written in an extremely simplistic way, as can be seen below:
“quand il n’y a plus rien à retrancher”
Based on real-life usage we may still improve the presentation (a bit ;) in the future.
The addin formalities
If you follow this blog for a bit, you can safely skip this part. A few things to make our new addin available and easy to use:
- Add the addin bindings into
inst/addins.dcf
Name: runProfiler
Description: experimental, runProfiler
Binding: runProfiler
Interactive: false- Re-install the package
- Assign a keyboard shortcut in the
Tools -> Addins -> Browse Addins... -> Keyboard Shortcuts...menu in RStudio:
Assigning a keyboard shortcut to use the Addin
TL;DR - Just give me the package
References
- Profiling R code for speed at Writing R Extensions
- Profiling R code for memory use at Writing R Extensions
- system.time help
- Profvis package with useful graphical overviews.
- Microbenchmark package infrastructure to accurately measure and compare the execution time of R expressions
- parallel package
- callR package - to perform a computation in a separate R process